Hospitality Revenue Dashboard
Explore booking performance, revenue trends, and channel comparisons.
I turn data into clear business decisions through dashboards, analysis, and practical insights. Currently pursuing a PhD in Information Technology at Trine University.
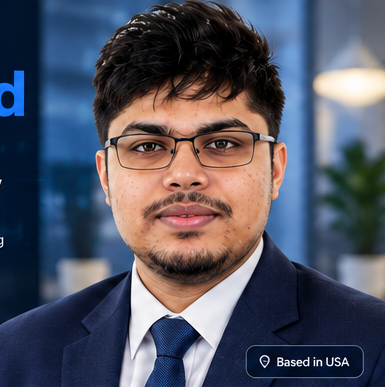
I approach analytics as a bridge between complex information and practical business action — from asking the right questions to presenting the answer clearly.
Define stakeholder goals, KPIs, and the business problem before starting analysis.
Use structured data, queries, and exploratory techniques to discover useful patterns.
Translate findings into dashboards, clear narratives, and decision-ready recommendations.
Core areas I use and continue developing.
Power BI, DAX, dashboards, KPI design, data storytelling.
SQL, Excel, Python, data cleaning, exploratory analysis.
Requirements, process mapping, stakeholder communication, reporting.
Sample case-study outlines based on my analytics interests. Replace with verified project results and screenshots before sharing with recruiters.
Explore booking performance, revenue trends, and channel comparisons.
Segment customers and identify patterns in retention and spending.
Map supply chain practices to delivery service quality indicators.
Adjust a business scenario and see how the projected metrics change. This is an educational simulation, not actual company data or a forecast.
Starting monthly revenue: $10,000 · 6-month compounding
Choose a sample business metric
All breakdown values are illustrative, for demonstrating interactive data visualization.
Trine University, United States · Doctoral studies
International American University
University of Hertfordshire, London
Indraprastha International University
Interested in collaborating on business analysis, reporting, or dashboard projects?
Add your real email, LinkedIn profile, resume, and project links before publishing.
This is a proposed case-study structure, not a claim of completed work.